datahack / visualizer
It was a quick protype developed during the Big Data Hackathon organized by HackHackers Delhi Chapter.
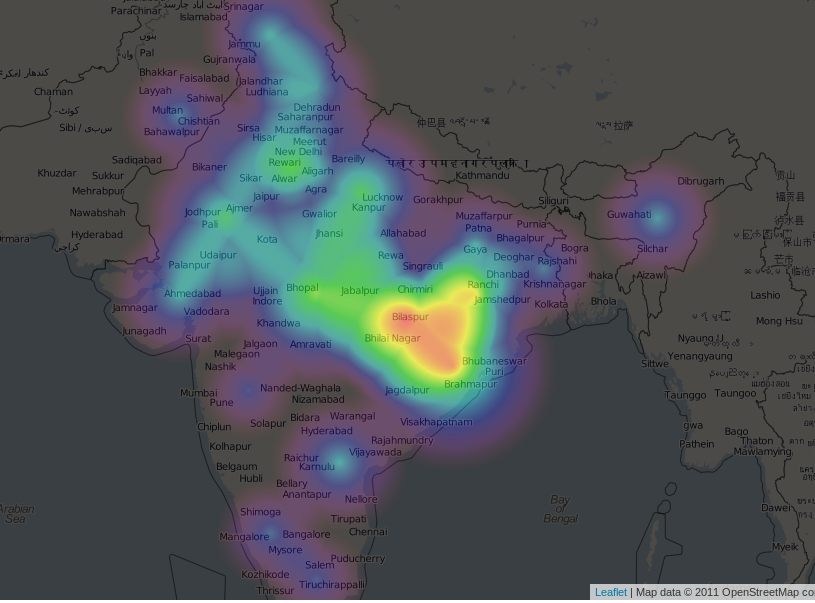
The outcome was a heatmap of India, depicting the infant mortality rates in different states of India (probably in 2005; data obtained from http://data.gov.in/ ).
It was a product of a quick one-day hackthon (journalists + coders), that took place around Feb'13.
This repo is a revised version of the same, compatible with Django 1.6.*

Usage
(requires Django 1.6)
python manage.py runserver
Go to http://localhost:8000 to browse India's position on the map, zoom right in to see the distribution.
Contributors: